


Robert Sutton, Executive Vice President of Innovation at BNSF Logistics, reviews how month-over-month market and economic factors affect transportation and the supply chain.

PRICES RISE AND SUPPLY CHAIN DISRUPTIONS CONTINUE
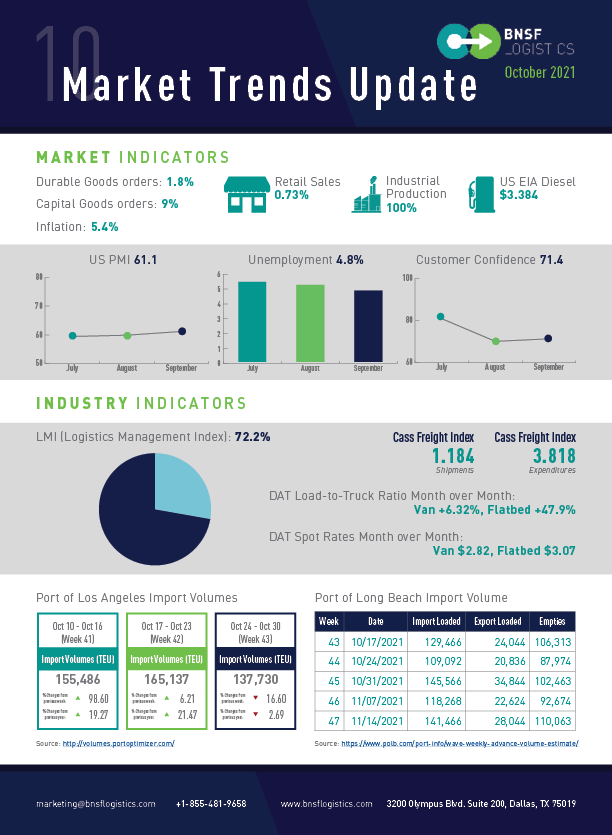
U.S. unemployment in September was 4.8% which was a slight drop from August and follows the trend of gradual but slow improvement. For September there were 194,000 jobs created, which is a decrease from August which had 235,000 jobs created. However, these two months combined are still less than what we saw in July alone. The issue is not the availability of jobs, as we currently have 10.5 million open positions, but rather not enough individuals coming back into the workforce after COVID. This is demonstrated by the labor participation rate which has hovered around 61.6% since last summer (down from 63.3% pre-pandemic) which equates to roughly 5 million people that are still on the sidelines. One positive note, weekly new claims for unemployment have crossed the 300,000 threshold since the beginning of the pandemic, but only 293,000 individuals filed for initial claims last week.
Retail sales rose 0.7% in September to $625.4 Billion, which is just below the high set in April. This is a surprising increase since the general consensus was that with rising prices and persisting supply chain challenges, spending would drop. Sales are up a total of 13.9% compared to this time last year, and 15.6% excluding automobile sales. The annualized rate of inflation rose to 5.4% after a slight fall in August, while the core inflation rate remained at an annualized rate of 4.0%. As prices rise due to scarcity caused by supply chain disruptions and as fuel prices continue to rise, inflation will likely be driven even higher. Consumer sentiment, which tends to be a leading indicator, fell again in October to 71.4, which is the second-lowest level since 2011. This is due to consumers growing more concerned with both current conditions and economic outlook.
New home starts were down 1.6% in September with a seasonally adjusted rate of 1.555 million homes, compared to 1.58 million homes in August. Permits also fell by 7.7% to an annual rate of 1.589 million in September. This larger decline in permits is likely related to many factors, including rising prices and materials scarcity caused by supply chain disruptions.
Automobile sales are continuing to see a decline. The global microchip shortage that has left U.S. showrooms bare for months continues to hammer automakers, with many of the large OEMs reporting lower monthly sales yet again in September. This signals a rough stretch ahead as the year comes to a close. The market fell 25% this past month to the lowest tally for September since 2010 with just under 1 million units sold. We have seen a 13% decline this quarter, while the year’s volume is still up 13%. The seasonally adjusted sales rate for September is at 12.2 million units, which is down 34% from the 18.5 million pace achieved in April. This has been caused by a lack of inventory, hampered production from supply chain disruptions, higher prices, and fewer purchase incentives for buyers.
INCREASE IN INDEXES
The Purchasing Manager’s Index (PMI) for September was 61.1%, which is an increase from August (59.9%) and the 16th straight month of expansion in the manufacturing sector. Durable goods orders are up 1.8%, with an increase in new orders (1.8%), unfilled orders (1.0%), and inventories (0.8%), as well as a decrease in shipments (0.5%). Capital goods saw a 9% increase this past month, with an increase in nondefense new orders of 9% and a decrease in defense new orders of 8.3%.
The Logistics Management Index (LMI) for September dropped from the previous month at 72.2%. This decrease was a result of a decrease in inventory levels while offset by high prices across the supply chain. The LMI index has been above 70 for eight consecutive months, as well as 11 of the past 13 months. While we have seen peaks like this before, never for such an extended period of time. Transportation capacity is down 3.3 points to 37.2% this month, indicating continued downward pressure, while transportation utilization is down 3.1 points to 69.5%, indicating little room to take on more demand. Additionally, while transportation prices dropped slightly to 92.4% it still indicates significant upward pressure on rates. Looking at the other factors that make up LMI, warehousing and inventories, we have seen an increase of 8.8 points to 47.9% for warehouse capacity, an increase in warehousing prices, and an increase of 0.7 to 86.6 for inventory costs, while the inventory level is down 5.2 points to 58.6%.
COVID-19 UPDATE – CASES DECREASE AS VACCINATION RATES RISE
We are now seeing big declines in the number of new cases and hospitalizations. The peak of new cases was in mid-September at over 175,000 new cases per day. We are now seeing about half that level with a 7-day average of 83,000 new cases per day. 7.5 million Americans received their first dose of the vaccine this past month, putting the US at a first dose vaccination rate of about 66% and a full vaccination rate of about 58%.