


Robert Sutton, Executive Vice President of Innovation at BNSF Logistics, reviews how month-over-month market and economic factors affect transportation and the supply chain.
CONSUMERS ARE HESITANT AS CASES RISES
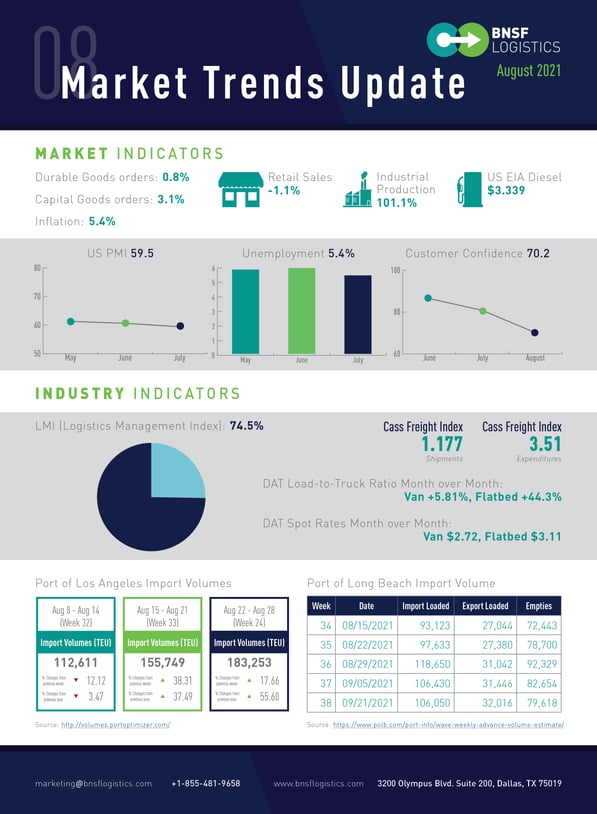
U.S. unemployment is 5.4% - the lowest observed in the last seventeen months. 943,000 jobs were created in July on top of the 845,000 jobs added in June. With states opting out of federal supplemental unemployment benefits, job increases were expected, and we’ll likely see that trend continue in August. The labor participation rate also saw a slight uptick indicating more people are starting to get off the sidelines and back into the job market. 7.2 million jobs have been added in the last 12 months, with 4.1 million added since January. However that is still 5.7 million jobs short of pre-pandemic levels without factoring in normal annual growth. There are currently 10.1 million job openings indicating jobs are available but finding the right labor in the right place with the right skill level continues to prove challenging.
In July retail sales dropped 1.1% which is likely attributable to the recent increase in COVID cases due to the delta variant and as the federal direct stimulus and unemployment assistant has run its course. The consumer price index (CPI), which measures inflation, rose 0.5% in July - which is the fifth month in a row that the metric has risen at a rate greater than 0.5%. Overall inflation sits at 5.4% over the last 12 months and 4.3% for core inflation. This could continue to surge upward as we lap the back half of 2020 where prices were rising at a much slower pace. This would put pressure on purchasing power and downward pressure on retail sales and other economic activity.
The consumer sentiment is a survey of household’s confidence in the economy on five factors including: personal and business financial situation and outlook, as well as current attitude towards buying major household items. This makes is more of a leading indicator for consumer behavior and we saw the metric drop significantly from 81.2 to 70.7 which is the lowest since 2011 and below any reading during the pandemic. This is caused by consumers sensing that the increase in COVID-19 cases means the pandemic will not end soon which causes a negative reaction and assessment around the economy’s expected performance. Consumers are taking a wait-and-see approach to spending.
New home starts dropped 7% to a seasonally adjusted rate of 1.534 million units with permits rising 2.6% to a rate of 1.635 million in July. Single-family permits fell to a rate of 1 million units, while multifamily unit permits jumped 11.2%. The housing market remains constrained as the prices in materials and labor costs increase. Houses that were authorized for construction but not yet started were the third-highest on record which indicates that builders are hesitant to take new projects. Although we’re seeing lumber prices decreasing slightly, there is still downward pressure on new constructions with existing home inventory prices still surging.
Vehicle sales fell 4.2% month-over-month in July, falling to 14.8 million seasonally adjusted annual units, which is down from 15.4 in May. Consumer demand for vehicles is still high that producers can’t seem to satisfy. With scarcity in supply, new vehicle prices are up 5% and used vehicle prices up 40% year-over-year.
SUPPLY CHAIN REMAINS CONSTRAINEDAS DEMAND CONTINUES TO OUSTRIP SUPPLY
The Purchasing Manager’s Index (PMI) for July is 59.5. Durable goods orders are up 0.8%, which is the 13th increase in the last 14 months. Excluding transportation equipment, durable goods rose 0.3%. Shipments have also been up, which indicates that these goods are being moved and delivered.
Logistics Management Index (LMI) for July is down slightly from the previous month at 74.5% but still the 3rd highest reading in the index’s history. Looking at the 3 key factors making up the index (inventories, warehousing, and transportation) we see that capacity is not increasing significantly while demand and utilization remain at very high levels which are driving prices ever higher. The shocks experienced by the supply chain in the last year have caused changes in buying habits of purchasing departments effectively abandoning long held JIT principles due to long lead times and material scarcity. This increase in order size and order frequency only works to compound the constrained environment creating a positive feedback loop where the tight capacity in one sector is creating further tightness in other areas. The big question of course is when will things normalize – this is extremely tough to call as we continue to see COVID impacting factories around the globe so for sure not anytime this year and likely through the 1st quarter of 2022 or longer.
COVID-19’S EFFECTS ON THE ECONOMY
We are seeing a significant surge nationwide from the Delta variant. The 7-day average has gone up 3X in the last 3 weeks to 139,873 cases. One side effect is that we are also seeing a sharper increase in the number of people receiving a vaccination. 11 million were vaccinated over the prior 3-week period where the previous 11 million had taken 5 weeks – a 60%+ increase in weekly dosages. From an economic standpoint, we might see more of a risk on the service side of the economy as it relates to crowds and events. The sale and subsequent movement of goods are not expected to be as affected at this time especially as consumers were able to adjust during last years’ periods of lock-down. For the back half of the year, we expect to see ripple effects in the supply chain as the variant impacts factories and ports are the globe with shutdowns.